Renewable Energy Asset Management: A Practical Guide
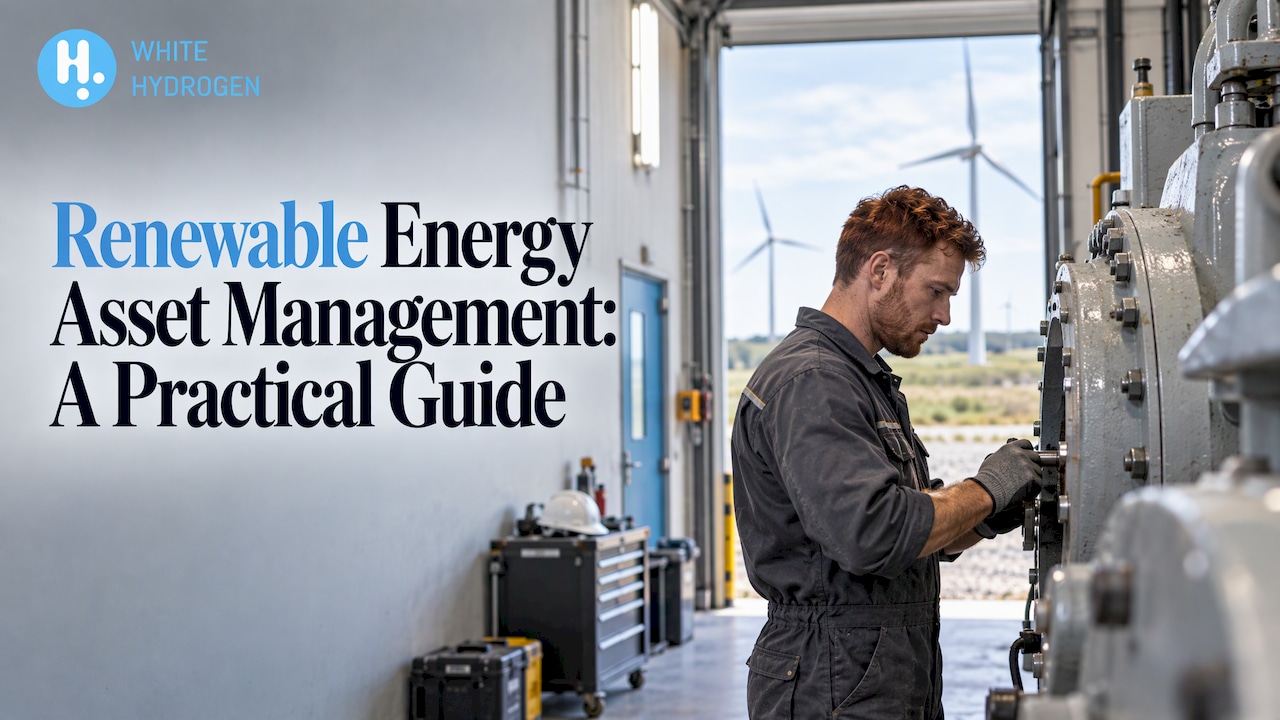
Renewable energy asset management is the commercial, financial and administrative running of a generating asset after it is built, with technical work supervised rather than performed. It works only as well as the production data behind it. Producers who can show verified, comparable output get better reporting, cleaner contracts and a stronger case with lenders, partners and communities. That is the idea behind the open platform at Whiteh2coin, where green energy facilities connect, measure and verify their impact.
TL;DR
- Asset management is the layer above operations and maintenance (O&M): it manages contracts, cash flow, reporting and performance against guarantees.
- The most useful KPIs compare actual output with budget, forecast and contractual availability, so the data feeding them must be trustworthy.
- Published research shows availability figures can differ sharply from real performance, which is why independent verification matters.
- A single platform for technical and non-technical data replaces spreadsheets and data silos, and is the direction industry guidance points to.
- Waste-to-hydrogen and other small or local projects benefit most from transparent, quantified production records.
Table of Contents
- What renewable energy asset management actually covers
- Why asset management and O&M should not be the same check
- The KPIs that matter
- A worked example: the same plant, two reporting setups
- Why spreadsheets and data silos hold portfolios back
- What to look for in an asset management platform
- Where waste-to-hydrogen and local projects fit
- How Whiteh2coin fits
- A starting routine for producers
- FAQ
- Sources
What renewable energy asset management actually covers
The standard definition comes from ISO 55000, the international asset management standard: the coordinated activities of an organization to generate value from its assets. Applied to a solar park, wind farm, storage unit or hydrogen facility, that means keeping the asset productive and financially sound across its whole life.
The SolarPower Europe guidelines draw a useful line. O&M providers take care of the plant technically, while asset managers handle the commercial and financial management of the investment and supervise the technical activities. Think of the O&M contractor as the mechanic and the asset manager as the person who checks the mechanic’s work, pays the bills and answers to the owners.
In practice the job includes:
- Performance monitoring. Comparing output with forecasts, budgets and any contractual guarantees.
- Contract administration. Power purchase agreements, O&M agreements, land leases, warranties and grid connection terms.
- Financial management. Accounting, cash flow, debt and equity relations, tax administration and liaison with investors and banks.
- Reporting. Financial statements, profitability analyses and debt compliance overviews, as set out in the same SolarPower Europe guidance.
- Optimization. Cutting costs, renegotiating contracts and restructuring finance where it pays.
Some organizations stretch the scope from project inception to the end of useful life. Others use the term only for the operating phase. For a producer reading this, the working definition is simple: asset management is everything that turns a running plant into a reliable, reportable source of value.
Why asset management and O&M should not be the same check
O&M reports availability: the share of time or production a plant is ready to generate. The asset manager’s job is to verify that figure, compare it with the guarantee and quantify any shortfall in lost energy and revenue. When the same party produces and checks the number, nobody is independently reviewing it.
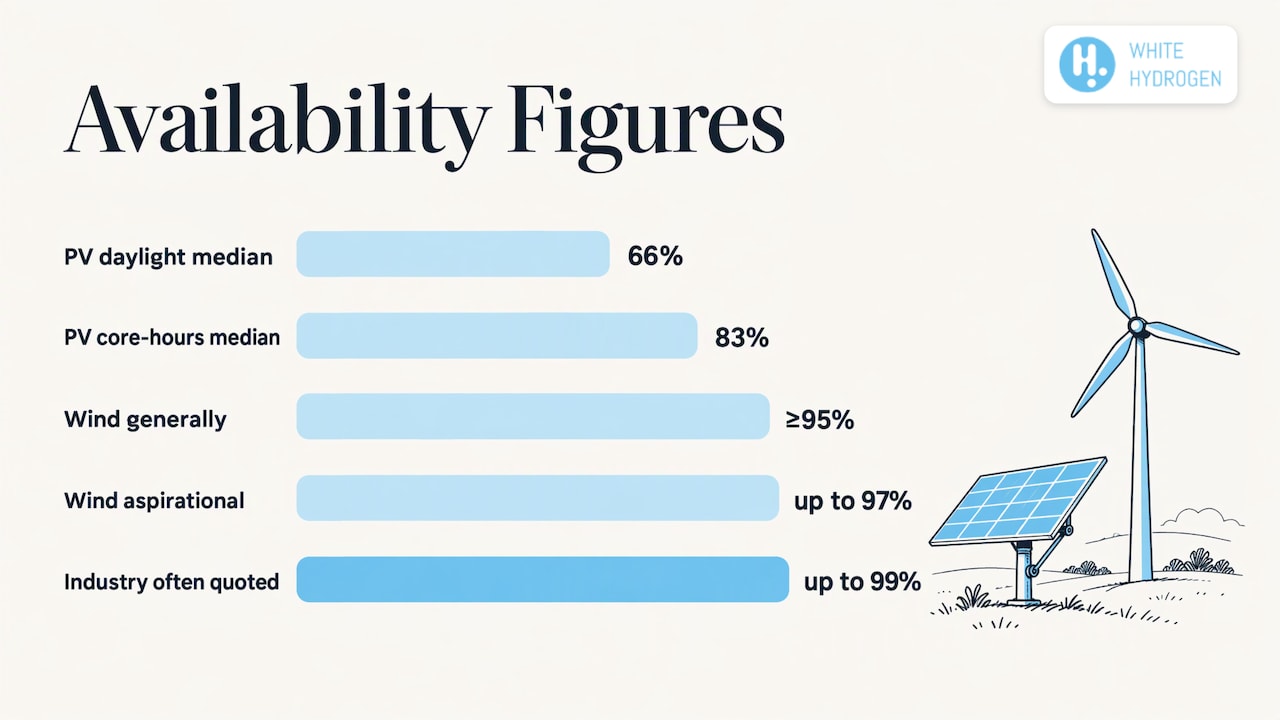
This is not a theoretical concern. A January 2026 study in EPJ Photovoltaics analyzed more than 2 GWp of PV plants and found that single-axis tracker availability had a median of 66% across all daylight hours and 83% in core hours, with a wide range, well below the figures of up to 99% often quoted in the industry. The authors point to missing data as a main systematic problem and to proprietary control logic that makes it hard to confirm that equipment behaves as expected.
Wind data tells a more settled story, and it shows what good benchmarking looks like. The ORE Catapult SPARTA report covering April 2022 to March 2025 explains that wind farms generally operate at or above 95% availability, with up to 97% aspirational. The point is not the exact number. It is that a figure means something only when everyone calculates it the same way and the underlying data is complete.
The KPIs that matter
Two kinds of metrics matter, and a good asset management routine tracks both.
Asset performance
- Availability. How much of the time, or of the available resource, the plant could produce. Production Based Availability, used in wind benchmarking, measures how well a turbine uses the wind available without penalizing low-wind periods.
- Yield against budget. Actual energy produced against the figure in the financial model.
- Lost production. Energy not generated because of faults, curtailment or delays, translated into revenue.
- Reliability. How often and how long equipment fails.
The SPARTA program shows how deep this can go: owners and operators can supply up to 159 KPIs and see more than 500 monthly benchmarks across availability, production, reliability and operations. A small producer does not need that many. It needs a short list it can trust.
Service quality of the asset manager
SolarPower Europe lists Reports Compliance Rate, Invoicing Compliance Rate, Contracts Optimisation Rate, Requests Treated and Timely Response Rate as service-quality indicators, and names the asset manager’s track record as one of the most important signals. Whether you manage assets in-house or with a partner, these tell you whether the administrative side is under control.
A worked example: the same plant, two reporting setups
Take a hypothetical 5 MW project with an availability guarantee in its O&M contract. This is an illustration, not a real case.
In the first setup, the O&M contractor emails a monthly availability percentage. The owner files it, and no one recalculates it. If the number is generous, or if data gaps were quietly excluded, the owner never learns that a compensation claim was available.
In the second setup, production and event data flow into a shared record. The asset manager recalculates availability from the raw data, compares it with the contract, converts any gap into lost kilowatt-hours and revenue, and raises the claim. Investor reports draw on the same record, so they match what the plant really did.
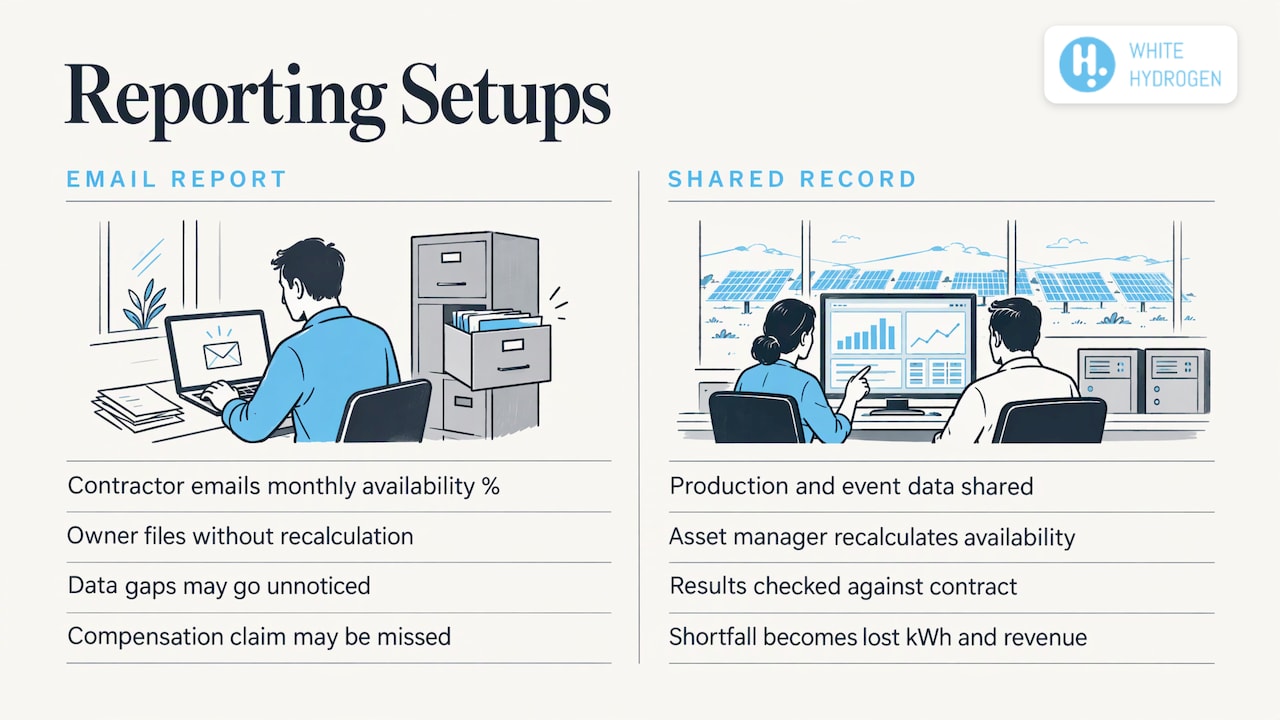
The plant and the contract are identical. The difference is data that can be checked. That difference is what asset management software, and platforms built around verified production, are for.
Why spreadsheets and data silos hold portfolios back
Most small portfolios start in spreadsheets. They work until the third site, the second technology or the first lender audit.
Kearney’s report on digital operations in renewables states that more than 70 percent of collected operational data goes unused, that silos across SCADA systems, sensors and third-party platforms hinder real-time decisions, and that owners often lack access to the full data set because equipment makers provide only selected data points.
SolarPower Europe’s guidance is direct: asset managers should rely on a specialized platform to store, manage and analyze technical and non-technical data. It says this addresses three challenges: loss of generation and income, loss of time, and lack of transparency, compared with the traditional linear chain from asset to O&M contractor to asset manager to owner. A PV Tech article from 2020 describes the same trend toward bringing monitoring systems, maintenance software and enterprise systems into one central platform.
McKinsey’s 2026 analysis of renewables O&M adds the next step. It describes how technology can integrate SCADA, maintenance history, condition monitoring, manufacturer documentation and inventory data so maintenance becomes risk- and condition-informed rather than calendar-driven. It also lists what lower-performing portfolios share: frequent minor failures from missed preventive maintenance, resource and spare-parts misalignment, and costly, underperforming service agreements.
What to look for in an asset management platform
Whether you run a single hydrogen plant or a mixed portfolio, judge a platform on a few practical criteria.
- Data governance first. Deloitte advises that data governance and cybersecurity should sit at the core of any digital asset management strategy, with the data architecture designed first because it will evolve with technology and threats.
- A plan, not a pilot. Deloitte warns that cherry-picking pilot projects without a comprehensive plan will likely not deliver the expected benefits. Each digital step should fit a wider strategy.
- Technical and non-technical data together. Output, events, contracts, invoices and reports belong in one place, as SolarPower Europe recommends.
- Verifiable records. The figure you report should be traceable to the production that created it.
- Controlled processes. The IWEA and SEAI guidance on wind farm asset management and ISO 55001 stresses that asset management plans need to be executed through controlled processes, with planned changes managed.
- Fit for your technology. Waste-to-hydrogen, solar, wind and storage have different data, but you gain from comparing them in one view.
Where waste-to-hydrogen and local projects fit
Most asset management guidance was written for utility-scale solar and wind. Newer technologies, such as plants that turn waste into green hydrogen, face the same questions with less published benchmarking: what did the plant produce, how was it verified, and what did it displace?
For these projects, transparency is not a nice extra. A local organization seeking funding, an investor weighing a project or an activist tracking carbon footprint reduction all ask the same thing: can the claimed result be quantified and trusted? Asset management answers that question over time, and the answer is only as good as the data trail.
How Whiteh2coin fits
The White Hydrogen Coalition builds an open platform where clean energy producers and facilities converting waste into green hydrogen and other sustainable energy can connect, measure and verify their impact. Our approach combines blockchain-based production tracking with verified production processes, so results are transparent and quantifiable. The platform supports multiple renewable technologies, and it sits alongside a carbon footprint reduction ecosystem and a blockchain-based crowdfunding solution for green energy plant projects.
For an asset manager or facility operator, the practical value lies in the record. Verified production data feeds the reports lenders, partners and communities ask for, and it gives your KPIs a common basis. Producers who want to connect a facility can start at the WH2C platform page.
The crowdfunding solution also serves local projects that need funding while keeping a quantifiable environmental impact on record, which matters to the community organizations and investors who follow them.
A starting routine for producers
You do not need a large team to begin asset management well. A workable first routine:
- List every contract with its renewal date, guarantees and reporting duties.
- Pick five KPIs: availability, yield against budget, lost production, response time to faults and report timeliness.
- Define each KPI in writing, including how missing data is handled. The tracker study shows why gaps matter.
- Recalculate supplier-reported figures from raw production data at least quarterly.
- Centralize the records so that technical and financial teams read the same numbers.
- Review annually against budget and adjust contracts, maintenance plans and reporting.
If your portfolio grows across vintages, equipment makers and regions, the complexity compounds. Kearney’s example of a mid-sized operator with about 2 GW across up to 10 assets of different ages, three wind turbine makers and panels from at least two manufacturers shows how ad-hoc planning breaks down. Standard processes and a single data view are the remedy.
FAQ
What is renewable energy asset management?
It is the commercial, financial and administrative management of renewable generating assets, with oversight of the technical work done by O&M providers. It covers performance monitoring, contracts, cash flow, reporting and optimization. The aim is to generate the most value from the asset over its life while controlling risk.
How is asset management different from O&M?
O&M is the technical execution: inspections, repairs and keeping equipment running. Asset management is the commercial layer that supervises that work, verifies reported availability and handles contracts and finances. Keeping the two checks separate means someone independently reviews the figures.
Which KPIs should I track first?
Start with availability, yield against budget and lost production, then add reliability and report timeliness. SolarPower Europe also suggests service-quality measures such as reports compliance and timely response. Define each in writing so results stay comparable over time.
Do small or local energy projects need asset management software?
Spreadsheets can cover a single site, but industry guidance recommends moving to a specialized platform as portfolios diversify. A shared, verifiable record of production also helps projects report to funders and communities. The right time to move is before lenders or partners ask for audited data.
Sources
- SolarPower Europe Asset Management Best Practice Guidelines v2.0
- ORE Catapult SPARTA Performance & Reliability Report 2025
- EPJ Photovoltaics: Assessing tracker availability in 2 GW solar power plants
- Kearney: Wired for performance
- McKinsey: Renewables O&M optimization with AI
- Deloitte Insights: Digital utility asset management
- IWEA and SEAI: Wind Farm Asset Management and ISO 55001
- PV Tech: Asset management, maximising the potential of solar power plants