Carbon Management Software: What It Does and How to Choose
Carbon management software is a system that collects activity data (fuel burned, electricity used, waste processed), turns it into greenhouse gas emissions with documented calculation methods, and helps you report and reduce them. For clean energy producers, the deciding question is trust: can anyone, from a regulator to a funder, see where each number came from? That is why we built the White Hydrogen platform around verified production tracking, so a facility’s impact can be measured, checked and shared.
This guide explains what the software does, how emissions are counted, what to look for, and where a platform built for waste-to-hydrogen and other clean energy sites fits.
TL;DR
- Carbon management software goes beyond a one-time inventory: it measures emissions by scope, keeps the evidence behind each figure, and supports reporting and reduction planning.
- Emissions are counted in three scopes under the GHG Protocol: direct emissions, purchased electricity, and everything else in the value chain.
- The most common complaint from users is the “black box”: figures they cannot trace. Visible methods and retained source data matter as much as the result.
- Reporting rules differ by jurisdiction, so check each framework you report under rather than assuming one covers all.
- Our WH2C platform connects clean energy facilities, tracks production with blockchain and helps them show measurable impact.
Table of Contents
- What carbon management software actually is
- How the software measures emissions across Scopes 1, 2 and 3
- Why verification matters more than dashboards
- What to look for when choosing carbon management software
- Implementing it without stalling
- Who benefits, and how
- Where White Hydrogen fits
- What to do next
- FAQ
- Sources
What carbon management software actually is
The term covers a family of tools. At the simple end is carbon accounting: you enter data and get a footprint. Carbon management adds the rest of the job: monitoring over time, analysis, planning, reduction targets and reporting. Gartner’s 2022 market guide on emissions management software describes this as a layer that consolidates and coordinates greenhouse gas management across the business footprint, covering monitoring, accounting, analyzing, planning, optimizing and reporting.
In practice, a good system does five things:
- Collects activity data from meters, invoices, production logs or other systems.
- Applies emission factors, the conversion values that turn, say, a unit of fuel into a mass of CO2-equivalent.
- Sorts results by scope and period so year-on-year comparison is possible.
- Keeps the audit trail: sources, units, assumptions and adjustments.
- Produces reports and tracks progress against reduction goals.
Spreadsheets can do steps one to three for a small site. They struggle with step four. Gartner’s analysts argue that legacy solutions and spreadsheets cannot support current auditability requirements, and that faulty Scope 1 and 2 reporting carries real risk for energy companies, including fines and reputational damage.
How the software measures emissions across Scopes 1, 2 and 3
Almost every tool follows the GHG Protocol Corporate Standard, first published in 2004. You first define your organizational boundary (which facilities and entities count) and your operational boundary (which emission sources count). Then emissions are sorted into three scopes:
| Scope | What it covers | Example for an energy facility |
|---|---|---|
| Scope 1 | Direct emissions from sources the organization owns or controls | Fuel burned on site, process emissions |
| Scope 2 | Emissions from generating purchased electricity | Grid power used to run a plant |
| Scope 3 | Other indirect emissions in the value chain, such as purchased materials, fuel transport and use of sold products | Feedstock delivery, transport of outputs |
Scope 1 and 2 are usually the easiest to measure because you hold the data. Scope 3 is harder. The Verdantix 2023 Green Quadrant study found that Scope 3 data acquisition remains a significant challenge: spend-based methods are limited by how transparent suppliers are, and activity-based methods demand extensive data collection.
A worked example of the logic
Imagine a small facility that records the quantity of a fuel used in a month. The software multiplies that activity data by an emission factor for that fuel, in matching units, and stores the result under Scope 1 for that month. If the unit on the invoice differs from the unit in the factor, the system converts it and should log the conversion. If a meter reading is missing for a week, the gap is filled by an estimate and the estimate should be flagged as such.
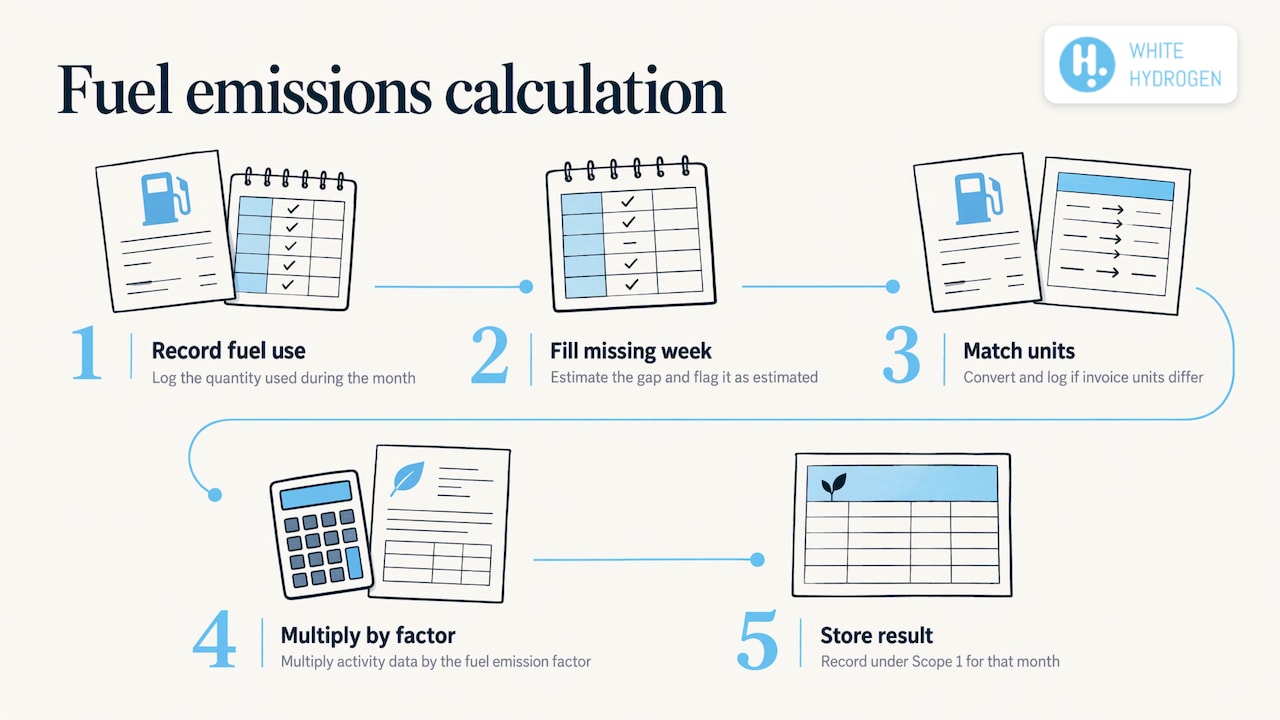
That last point is not a technicality. The U.S. EPA’s inventory documentation template advises recording the source, time coverage and unit for activity data and emission factors, plus any adjustments such as unit conversion or gap-filling. Software that does this automatically is doing the most valuable part of the work.
Why verification matters more than dashboards
A clean dashboard is easy to build. A number that survives scrutiny is harder. A 2024 UCL report on net zero tools for local authorities found that users valued these tools for saving time, raising awareness and communicating emissions to stakeholders. The same report listed the main negatives: unvalidated “black box” data that erodes trust, confusion over which tool to use, inconsistency between tools, and work-intensive data gathering.
One participant in that study put the trust problem bluntly, saying that if they could not see how a figure was calculated, they would lose trust in it. The lesson for any buyer: ask whether you can click from a reported number back to the data, factor and assumption behind it.
For clean energy producers this matters twice. You are selling or advertising a low-carbon product, so your own numbers are your credibility. And the people who read them (partners, funders, communities, regulators) usually cannot visit the plant. Verified, tamper-evident records do the visiting for them.
What to look for when choosing carbon management software
The market is crowded and the ranking pages mostly list large enterprise suites. The right pick depends on who you are. Use these criteria.
1. Fit with your kind of operation
General enterprise tools are built around corporate footprints: offices, travel, procurement. A facility that converts waste into hydrogen or other energy has a production process with its own inputs and outputs. The UCL study flagged poor fit to the user’s context as a recurring complaint. Ask whether the tool understands your process or asks you to squeeze it into generic categories.
2. Traceable calculations
Every figure should link to its activity data, emission factor, unit, time period and any adjustment. This follows directly from the documentation practice described above.
3. The reporting you actually owe
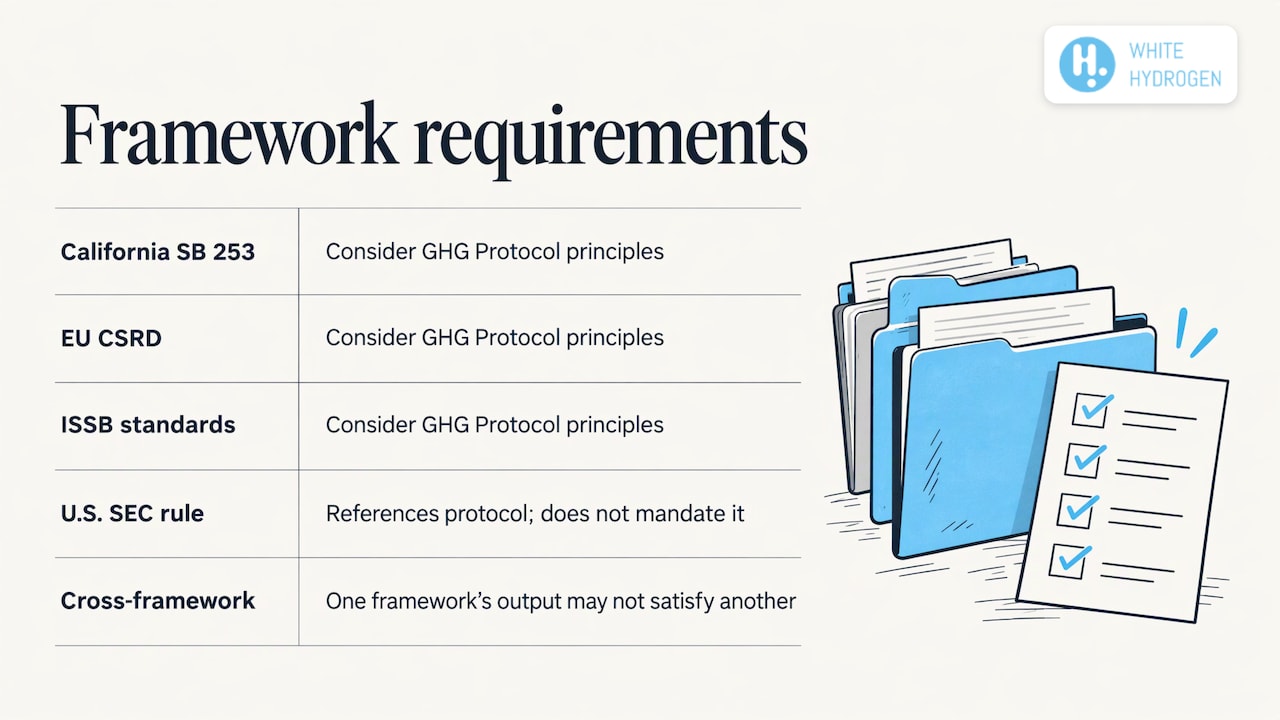
Framework requirements vary. Deloitte’s 2025 comparison notes that California’s SB 253, the EU’s CSRD and the ISSB standards require entities to consider GHG Protocol principles, while the U.S. SEC climate rule references but does not mandate the protocol. It also warns that information provided under one framework may not satisfy another regulator. So list the frameworks that apply to you, then confirm the software can produce each output. Your legal or compliance adviser should confirm which rules apply to your organization.
4. Features that match your priorities
In the Verdantix survey of 350 corporate net-zero decision-makers, the feature most sought over the following couple of years was voluntary carbon reporting, followed by financial metrics for emissions and facility-level data tools. Facility-level data is exactly where energy producers live.
5. Data effort
Work-intensive data gathering was one of the main frustrations in the UCL findings. Ask how data gets in: manual entry, uploads or direct connection to production systems. The less retyping, the fewer errors.
6. Who the software is built to serve
A tool aimed at a Fortune 500 sustainability team may be too heavy for a local project. A tool aimed at consumers may be too light for an operator. Match scale and purpose before comparing features.
Implementing it without stalling
Most projects stall in the first month because nobody decided what to measure. A workable sequence:
- Set boundaries. Decide which sites and sources are in scope, following the GHG Protocol approach.
- Pick the base period. A full year is the usual reference for comparison.
- Inventory your data sources. Meters, invoices, production logs, supplier records. Note who owns each.
- Load Scope 1 and 2 first. These are in your hands. Add Scope 3 categories in stages as supplier data improves.
- Document assumptions from day one. Gap-filling and conversions are normal; undocumented ones are the problem.
- Set reporting rhythm. Monthly review catches errors long before an annual report does.
Who benefits, and how
The same software serves different readers differently.
- Clean energy producers need defensible figures for partners, regulators and buyers. Gartner’s guide describes emissions management as a foundational capability for new green energy companies.
- Local organizations gain a shared, consistent way to measure and communicate progress, which the UCL users singled out as a benefit.
- Environmental advocates can point to documented, comparable data instead of claims.
- Investors in green technology can look for facilities whose figures are traceable to source records, which makes comparison between projects fairer.
This article is general information. It is not investment, legal or tax advice, and anyone with compliance or financing decisions to make should consult a qualified professional.
Where White Hydrogen fits
Most carbon management tools sit inside one company and look inward. We took a different route. The White Hydrogen Coalition runs an open platform where clean energy producers can connect their facilities, measure their impact and verify it. It is designed for facilities that turn waste into green hydrogen and other sustainable energy sources, and it supports multiple renewable technologies rather than one.
Two features answer the trust problem described above. First, the WH2C platform combines verified production processes with blockchain-based tracking, so results are transparent and quantifiable. Second, we offer a blockchain-based crowdfunding tool that lets local green energy projects seek funding while demonstrating their environmental impact in measurable terms.
If you operate a clean energy facility or develop a green energy project, see how the WH2C platform connects producers and tracks verified impact.
What to do next
Start with your own situation. Write down your scopes, the frameworks you report under, and the three numbers a partner or funder would ask for first. Then judge any tool, ours included, on one test: can each reported figure be traced to its source data and method? A platform that passes that test saves time at reporting season and holds up when someone asks hard questions. For facility operators and project developers working with waste-to-energy and green hydrogen, White Hydrogen was built around that test.
FAQ
Is carbon management software the same as carbon accounting software?
Not quite. Carbon accounting calculates a footprint from your data. Carbon management includes that calculation and adds monitoring, analysis, planning and reporting, so you can act on the numbers over time. Many products blur the two, so check the feature list rather than the label.
Does carbon management software cover Scope 3 emissions?
Most tools support all three scopes, but Scope 3 depends on data from suppliers and customers. Verdantix found that spend-based methods are limited by supplier transparency and activity-based methods need extensive data collection. Many organizations start with Scopes 1 and 2 and add Scope 3 categories in stages.
Which reporting frameworks should the software support?
That depends on where and how you report. California’s SB 253, the EU’s CSRD and the ISSB standards all draw on GHG Protocol principles, and one framework’s disclosures may not satisfy another regulator. List your obligations first, and ask a compliance adviser if you are unsure.
Can small or local projects use carbon management software?
Yes, but scale matters. Enterprise suites can be heavy for a single plant or community project. Look for tools with facility-level data, light data entry and clear, visible calculations, which are the things users in the UCL study valued.
Sources
- The Greenhouse Gas Protocol: Corporate Accounting and Reporting Standard (2004)
- U.S. EPA Templates for Creating a National GHG Inventory: Methods and Data Documentation (2020)
- Verdantix Green Quadrant: Enterprise Carbon Management Software 2023
- Deloitte IAS Plus Sustainability Spotlight: Comparison of Significant Climate Reporting Frameworks (13 May 2025)
- UCL Net Zero Tools and Toolkits Developers Guidance Report (June 2024)
- Gartner Market Guide for Gas Emissions Management Solutions (21 March 2022)
More articles
Green Hydrogen Production: How It Works and What It Takes
How green hydrogen is produced from renewable power and water: electrolyzer types, efficiency, costs, water needs and what makes a project work at scale.
Sustainability Data Platform: What It Does and How to Choose
A sustainability data platform collects, verifies and reports environmental data. See what it tracks, how it validates output and how to pick one for your site.
Renewable Energy Asset Management: A Practical Guide
What renewable energy asset management covers, which KPIs matter, how data platforms help, and why verified production data is the base of every decision.