Sustainability Data Platform: What It Does and How to Choose
A sustainability data platform is a system that collects environmental data from your operations, checks it, stores it in one place and turns it into numbers you can report and act on. For a clean energy producer, the useful version goes one step further: it ties each unit of output to a verified production record, so the impact you claim can be traced back to a meter. That is the idea behind the WH2C platform, which connects green energy facilities, measures their impact and verifies it with blockchain-based production tracking.
This guide is for producers, local organizations, activists and investors who want to understand what such a platform really does before they commit time or money to one.
TL;DR
- A sustainability data platform collects, maps, stores and integrates environmental data, then produces reports and analytics from it.
- Trust comes from the data trail: metered or sensor data, outlier checks, third-party audits and records that prevent double counting.
- Judge a platform on data quality, interoperability, update frequency and the reporting frameworks it supports, not on dashboard looks.
- For waste-to-hydrogen and other renewable producers, verified production tracking is what makes impact claims quantifiable.
- Our WH2C platform is built for facilities that want to connect, measure and verify their impact.
Table of Contents
- What a sustainability data platform is
- What environmental data a platform can collect
- How production is tracked and validated
- Features and integrations that matter
- Data quality, interoperability and update frequency
- From data to decisions
- Reporting frameworks differ by country
- Where the WH2C platform fits
- How to choose: a short checklist
- Who benefits most
- FAQ
- Sources
What a sustainability data platform is
Think of it as the plumbing under every sustainability claim. A solar farm says it avoided emissions. A waste-to-energy plant says it diverted tonnes from landfill. A community group says its project cut its footprint. Each claim is only as good as the data behind it. The platform is where that data is gathered, cleaned and kept.
Singapore’s IMDA describes sustainability data management in four phases: data collection, data mapping, data storage and data integration. Collection means getting readings from meters, sensors and records. Mapping means matching each reading to the right category, such as a facility, a fuel type or an emissions scope. Storage keeps it in a consistent structure. Integration links it to other systems, such as finance or a registry. The same playbook lists the kinds of figures organizations need to report, including water consumption in liters, waste disposed in kilograms and Scope 1, 2 and 3 emissions in tonnes. (Scope 1 is emissions from your own operations, Scope 2 is from purchased energy, Scope 3 is everything else along your value chain.)
How it differs from ESG reporting software
The two overlap, and many products do both. The difference is the starting point.
- Reporting software starts from the disclosure. It helps you fill in a framework and publish a report.
- A data platform starts from the source. It governs how raw readings are captured, validated and reused, and the report is one output among several.
For a producer, that distinction matters. If your readings are unreliable, a polished report only presents unreliable numbers more attractively. A platform that starts at the meter fixes the problem where it begins.
What environmental data a platform can collect
The range is wider than most newcomers expect. The World Bank’s guide to digital monitoring, reporting and verification (D-MRV) explains that digital MRV can collect project performance data in real time, using smart meters for power projects and remote sensors or satellite data for other activities. It can then analyze, format and report that data automatically.
IETA’s buyer’s guide to MRV adds that digital MRV is an end-to-end approach covering data collection, calculations, reporting, verification, auditability and issuance. It describes a shift from end-of-period snapshots toward continuous, near-real-time data streams, sometimes flowing by API directly to a crediting program. Sources of that data include direct metering, remote sensing, LiDAR and spectral scanners.
For a clean energy facility, the practical list usually looks like this:
| Data type | Typical source | Why it matters |
|---|---|---|
| Energy or hydrogen output | Meters, flow sensors | The basis of every impact claim |
| Input feedstock, such as waste volumes | Weighbridge or intake records | Shows what was diverted and converted |
| Equipment status | Device and system logs | Explains gaps and anomalies |
| Emissions factors | Reference databases | Converts output into avoided emissions |
| Timing of production | Time-stamped readings | Needed for matching output to consumption |
How production is tracked and validated
Collecting data is easy. Making others believe it is the hard part. Three mechanisms do most of the work.
Automated checks
The World Bank guide notes that D-MRV systems can build in triangulation techniques to flag errors or outliers. Its example is cross-checking rooftop solar output against local solar irradiance weather data. If a plant reports output that the weather cannot explain, the system raises a flag instead of passing it through. The same approach helps catch faulty sensors.
Third-party audit
The I-REC system tracks factual, auditable attributes of renewable electricity production as digital certificates, each based on one megawatt-hour. Those attributes include generator location, primary energy input, commissioning date, installed capacity, and the volume and timing of production. The guide requires production data to be audited by a third party, for example a national grid operator or regulator, before a certificate is issued.
Records that prevent double counting
A certificate is worthless if the same megawatt-hour is claimed twice. The EnergyTag protocol for one granular certificate scheme says that its configuration facilitates subhourly matching of production attributes to consumption, preventing double counting and double issuance. Its registry records certification details, beneficiary information and production details.
The pattern across all three is the same: a measured reading, an independent check and an unambiguous record of who owns the result. A tamper-resistant ledger is one way to keep that record. Our platform pairs blockchain technology with verified production processes for exactly this purpose, so each facility’s results are transparent and quantifiable.
Features and integrations that matter
Most products list the same headline features: dashboards, alerts, exports. The ones that decide whether the platform works for you are less visible.
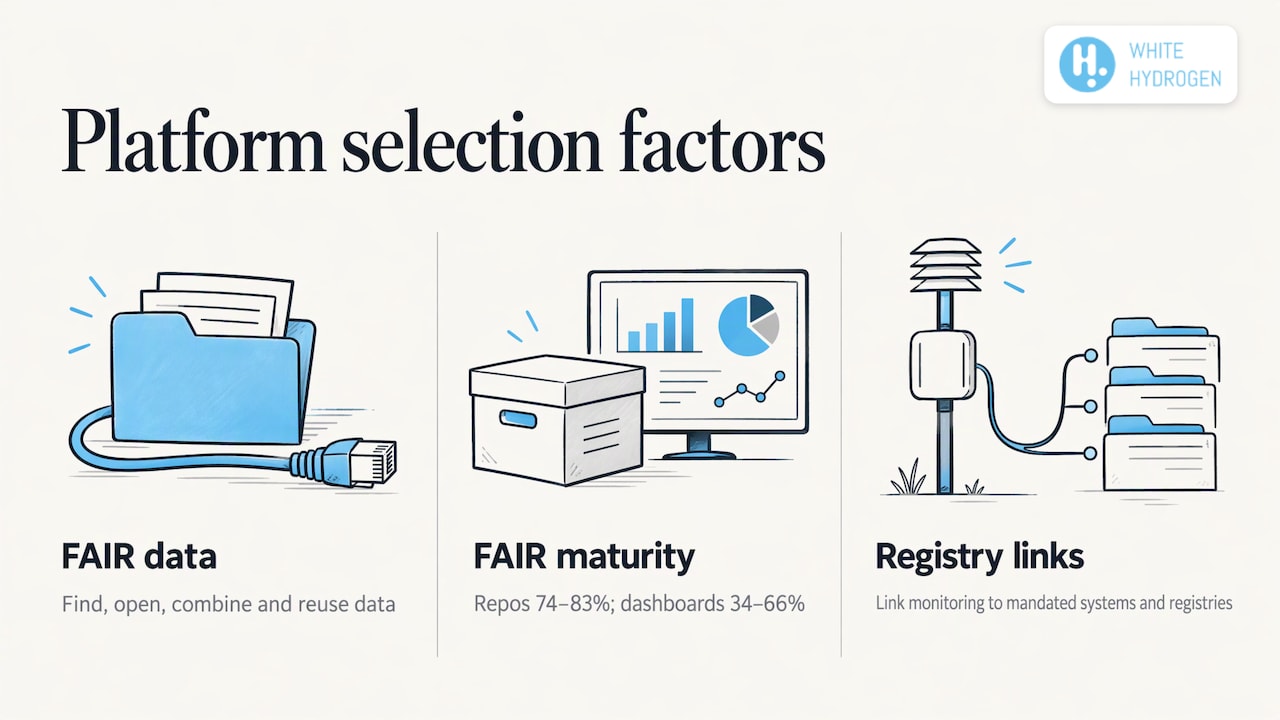
Data structure. The IEA’s guide on data platforms for smart buildings describes a layered architecture of device and systems, network and data layers, and advises owners to aim for the FAIR principles: Findable, Accessible, Interoperable and Re-useable. In plain terms, someone else should be able to find your data, open it, combine it with other data and use it again.
The platform shapes the data. A 2025 set of recommendations from the Research Data Alliance’s wind energy group found that the publishing platform tends to dictate how FAIR a dataset is. It recommends that platform developers adopt general metadata standards plus specialized domain standards. In its evaluation of 15 platforms, repositories scored 74 to 83 percent on FAIR maturity, while dashboards scored between 34 and 66 percent. A dashboard alone is a viewer, not a data foundation.
Registry connections. The World Bank notes that a modular D-MRV design lets project owners build their own monitoring component and connect it to mandated reporting systems and registries, which lowers verification cost and makes the approach easier to scale.
Data quality, interoperability and update frequency
These three decide whether the numbers survive scrutiny.
Quality and traceability
The EDM Council’s April 2024 playbook organizes ESG data management around eight components, including data quality management, data governance and a data control environment. It tells companies to define trusted data as the central objective, keep a business glossary and document data lineage, including manual and automated calculations. If you cannot show how a figure was produced, you cannot defend it. A practical walk-through of this discipline, from meter to report, is in this energy data governance checklist.
Interoperability
ISO’s 2025 mapping report defines interoperability, via ISO/IEC 18023-1, as the situation where producing and consuming applications both unambiguously understand the meaning and context of environmental data. Getting there takes standardized formats, common vocabularies and metadata protocols. The same report identifies over 1,000 ISO standards that support environmental data objectives, and finds fewer cover data dissemination and storage than other lifecycle stages. Ask any platform which standards it follows when data moves in or out.
Update frequency
PwC points out that sustainability data should be updated at the frequency of decision-making: quarterly for capital-allocation decisions, hourly for plant operators checking energy-efficiency thresholds. A producer running a plant needs far fresher data than an investor reviewing a portfolio. Match the refresh rate to who will use the numbers.
From data to decisions
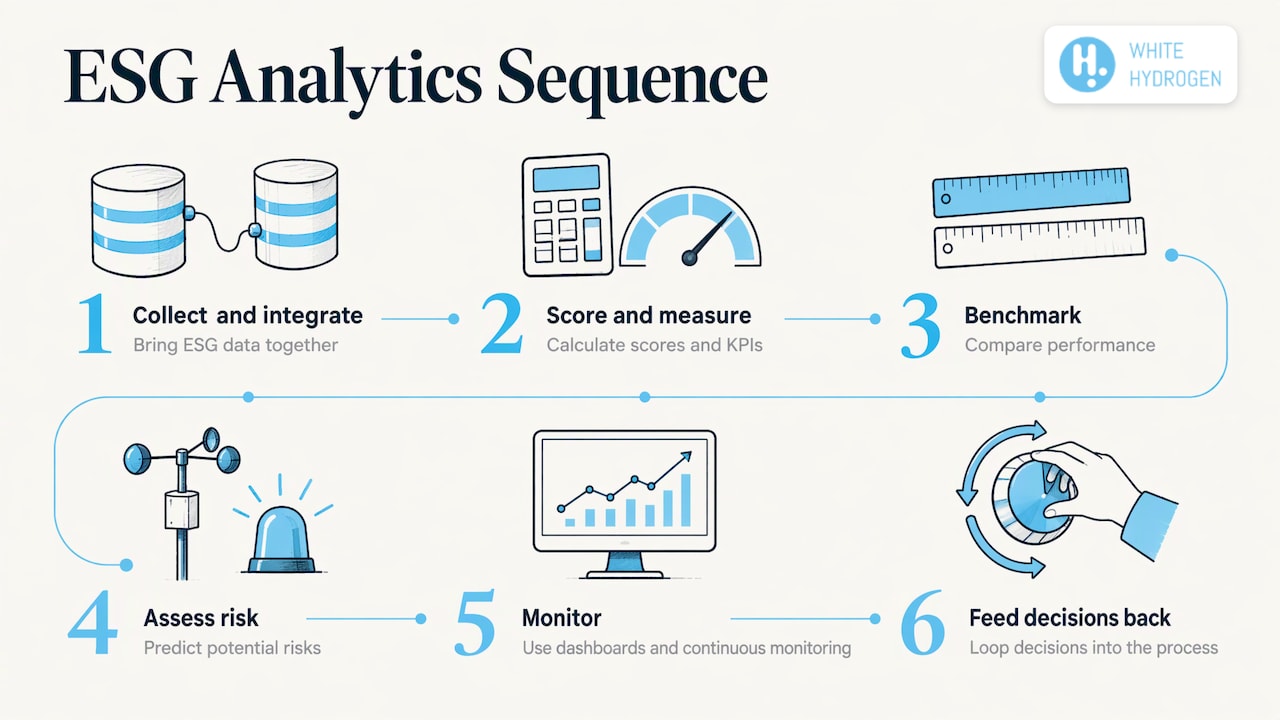
Data that sits in a database changes nothing. ICAEW’s data analytics community describes ESG analytics as a chain: data collection and integration, scoring and KPIs, benchmarking, predictive risk assessment, dashboards and continuous monitoring with a feedback loop on the decisions taken. That is what people mean by ESG analytics: using the data to manage risk and choose between options, not only to publish a report.
PwC adds that technology alone is not enough. Leaders also need guidelines, targets and incentives that define a decision logic. Its example is a company that weighed financial, environmental, social and reputational factors together when reviewing where it sourced energy. For energy projects, the same discipline starts by naming the operating decision the data should improve, as this piece on industrial AI operating decisions argues.
Reporting frameworks differ by country
A platform should feed whichever disclosure rules apply to you, and those rules depend on where you operate. In the EU, the Corporate Sustainability Reporting Directive (CSRD) is the binding regime. PwC notes that some companies with a presence in the EU begin CSRD disclosure in 2025 based on 2024 data. Other jurisdictions use different standards, and many frameworks, such as GRI, remain voluntary. Scope and thresholds change, so check the official text for your jurisdiction before you plan.
The practical point is the one the EDM Council makes: markets are moving from voluntary, unstructured ESG reporting toward mandatory, standardized disclosure. Collecting data once, in a structured way, and reusing it across frameworks saves rework later. For reporting obligations in your own jurisdiction, consult a qualified adviser.
Where the WH2C platform fits
Most sustainability tools are built for large corporations that need to disclose. The WH2C platform is built for the other side of the table: the facilities that produce clean energy. It is an open platform where green energy producers connect, measure their impact and verify it, covering waste-to-green-hydrogen conversion and other sustainable energy sources, not a single technology.
It includes blockchain-based production tracking, so verified production processes produce transparent and quantifiable results. It also supports a carbon footprint reduction ecosystem, and a blockchain-based crowdfunding solution that helps local green energy plant projects access funding while showing measurable environmental impact.
If you operate or develop a facility and want your impact to be measurable and verifiable, explore the WH2C platform.
How to choose: a short checklist
Use these questions with any platform, ours included.
- Where does the data start? Prefer direct metering and sensors over manual entry.
- What checks run automatically? Look for outlier detection and cross-checks against independent data such as weather.
- Who audits? Production data should be reviewable by an independent party.
- Can it prevent double counting? Each unit of output should have one unambiguous owner record.
- What standards does it use? Look for common formats, vocabularies and metadata so data moves cleanly.
- How often does data refresh? Match it to your decisions: hourly for operations, quarterly for capital.
- Can it connect outward? Registries, reporting systems and finance tools should be reachable by API.
- Does it serve your technology? An open platform that supports several renewable technologies avoids rebuilding as you grow.
Who benefits most
Clean energy producers gain a verified record of output and impact that investors and partners can examine. Local organizations gain a way to show a community project’s results in numbers. Environmental activists gain a clearer way to separate measured reductions from vague pledges. Investors in green technology gain visibility into what a facility actually produces. Nothing here is investment, legal or tax advice, and anyone weighing a financial decision should consult a licensed professional.
FAQ
What is a sustainability data platform?
It is a system that collects environmental data from your operations, maps it to categories, stores it consistently and integrates it with other systems. From that base it produces reports and analytics. The key difference from basic reporting software is that it governs the data from the source, not just the final disclosure.
What is ESG analytics?
ESG analytics uses collected data to score performance, benchmark against peers, assess risk and monitor results over time. ICAEW’s data analytics community describes it as a feedback loop, where findings inform the next decision. It goes beyond producing a report.
How does renewable energy data management validate production?
It combines metered readings, automated outlier checks and independent audit. Systems such as I-REC require third-party audit of production data before certificates are issued, and registries record production details to prevent the same output being counted twice.
Which reporting framework should a platform support?
That depends on where you operate. The EU’s CSRD is mandatory for companies in its scope, while many other frameworks are voluntary. A good platform keeps data structured so it can feed more than one framework without being collected again.
Sources
- Leveraging Digital Technologies for Sustainability (IMDA Singapore)
- Digital Monitoring, Reporting, and Verification Systems (World Bank)
- Buyers’ Guide to MRV (IETA)
- General Description of the I-REC System
- Flexidao GC Scheme Protocol, Configuration 3 (EnergyTag)
- A Guide on Data Platforms for Data-Driven Smart Buildings (IEA EBC Annex 81)
- Best Practice Recommendations for improving FAIR data (RDA Wind Energy)
- Playbook for Effective ESG and Sustainability Data Management (EDM Council)
- Global Environmental Data Standards Mapping (ISO)
- Sustainability data: From reporting to value creation (PwC)
- Harnessing Data Analytics for ESG Excellence (ICAEW)
- Energy data governance checklist
- Industrial AI operating decisions
More articles
Renewable Energy Asset Management: A Practical Guide
What renewable energy asset management covers, which KPIs matter, how data platforms help, and why verified production data is the base of every decision.
Industrial Decarbonization: Where Emissions Come From and How to Cut Them
Industrial decarbonization explained: where industrial carbon emissions come from, the five main levers, what they cost, and how producers can verify results.
Hydrogen Production Costs: What Drives the Price per Kilogram
What hydrogen costs per kilogram by pathway, what drives the price, how levelized cost is calculated, and where projects can cut costs, with sources.